
This post is an evaluation of the idea that new housing built today skews luxury while leaving affordable and mid-priced new home construction as under-served markets. To be clear this is a sub-issue of the larger issue which is a simple lack of sufficient supply as seen by the following quote from a research paper by FreddieMac.
“The United States is not building enough housing to meet demand. The current annual rate of construction is about 370,000 units below the level required by long-term housing demand. And after years of low levels of building, a significant shortfall has developed, with between 0.9 and 4.0 million too few housing units to accommodate long-term housing demand.” http://www.freddiemac.com/research/insight/20181205_major_challenge_to_u.s._housing_supply.page?
To examine the assertion that there is a price mismatch exacerbating the shortage we will first look at the prices of houses sold in the US and then compare this to U.S. Household earnings at a national scale.
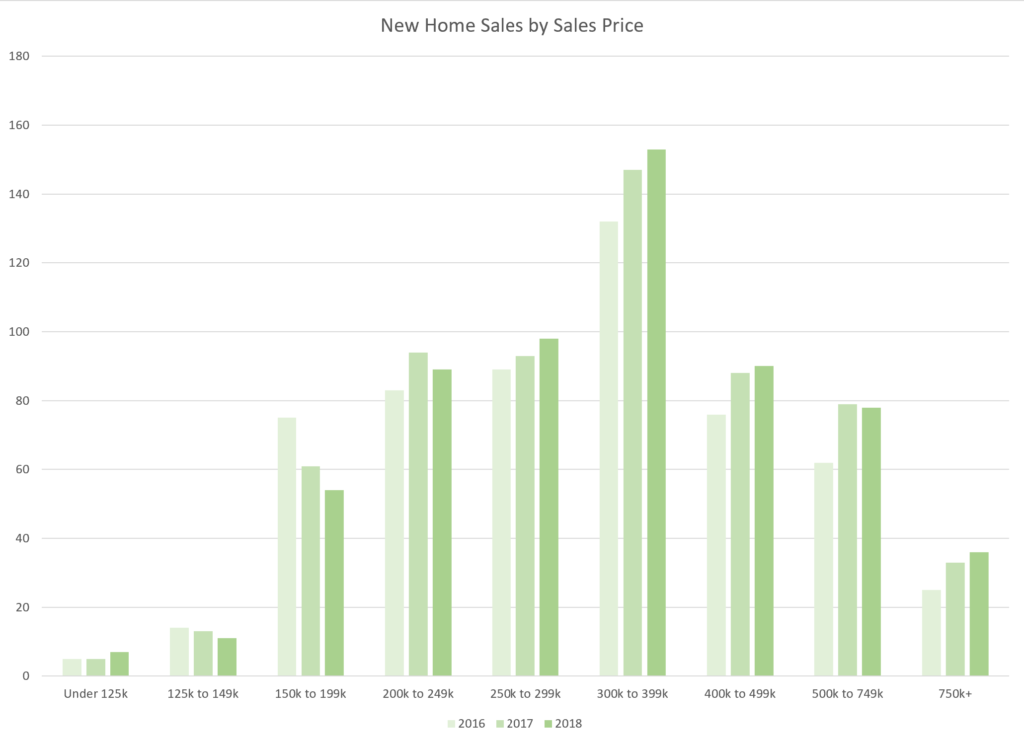
| Total | Under 125k | 125k to 149k | 150k to 199k | 200k to 249k | 250k to 299k | 300k to 399k | 400k to 499k | 500k to 749k | 750k+ | |
| 2016 | 561 | 5 | 14 | 75 | 83 | 89 | 132 | 76 | 62 | 25 |
| 2017 | 613 | 5 | 13 | 61 | 94 | 93 | 147 | 88 | 79 | 33 |
| 2018 | 617 | 7 | 11 | 54 | 89 | 98 | 153 | 90 | 78 | 36 |
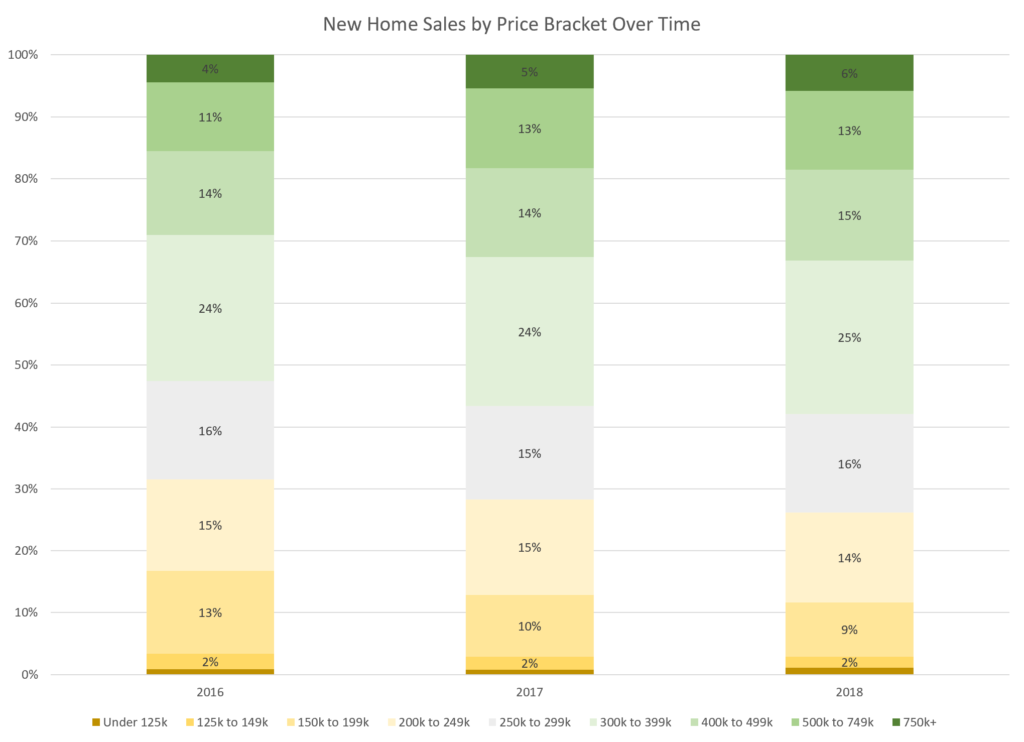
It appears that houses are on average getting more expensive over the last three years, but this could be due to simple inflation. In order to control for inflation, we will simply compare non-inflation adjusted earnings to get an idea of the ratio of housing price to what people are earning to see if housing is getting more expensive in real terms.
Since most Americans on the lower end of the income spectrum require a mortgage we will look at how much people should be making in order to afford a mortgage on the given house price. According to investopedia “Your front-end ratio is the percentage of your annual gross income that goes toward paying your mortgage, and in general it should not exceed 28%” https://www.investopedia.com/articles/pf/05/030905.asp
This leads us to the next factor which is interest rates which have changed over time. According to ValuePenguin the average interest rates for a 30 year fixed mortgage in 2016 was 3.65%, 2017 was 3.99%, and 2018 was 4.54%. https://www.valuepenguin.com/mortgages/historical-mortgage-rates It is important to keep in mind that credit and income may have more of an impact on the interest rates of lower income households than it will on higher income households but that is a topic for another article.
The other main determinant of a monthly payment is how much people put down on the house. This percentage has also fluctuated significantly from year to year. In 2016 it was 6.0%
https://thelendersnetwork.com/average-down-payment-on-a-house/
In 2017 it was 6.06% and in 2018 it was 5.37%.
https://www.housingwire.com/articles/49443-the-average-down-payment-is-much-smaller-than-you-think/
This also means that on average lower income households are much more likely to be paying additional interest in the form of PMI and other associated fees.
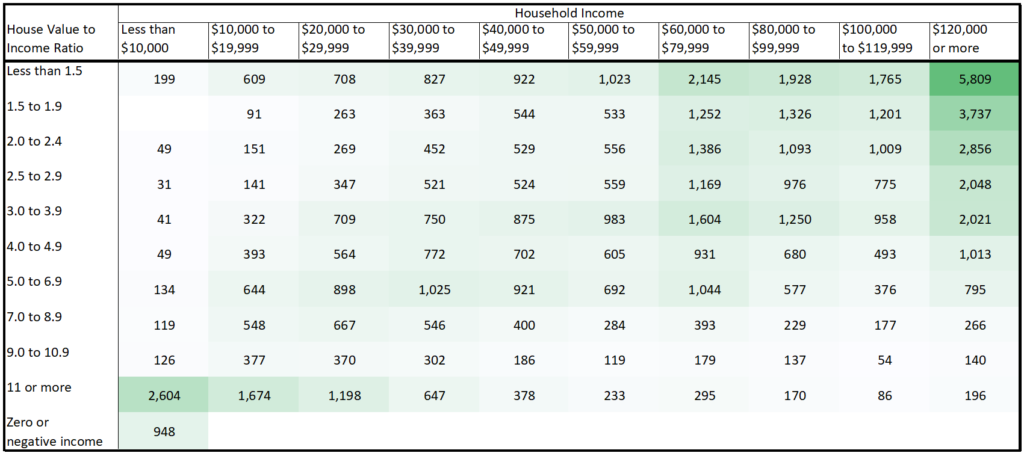
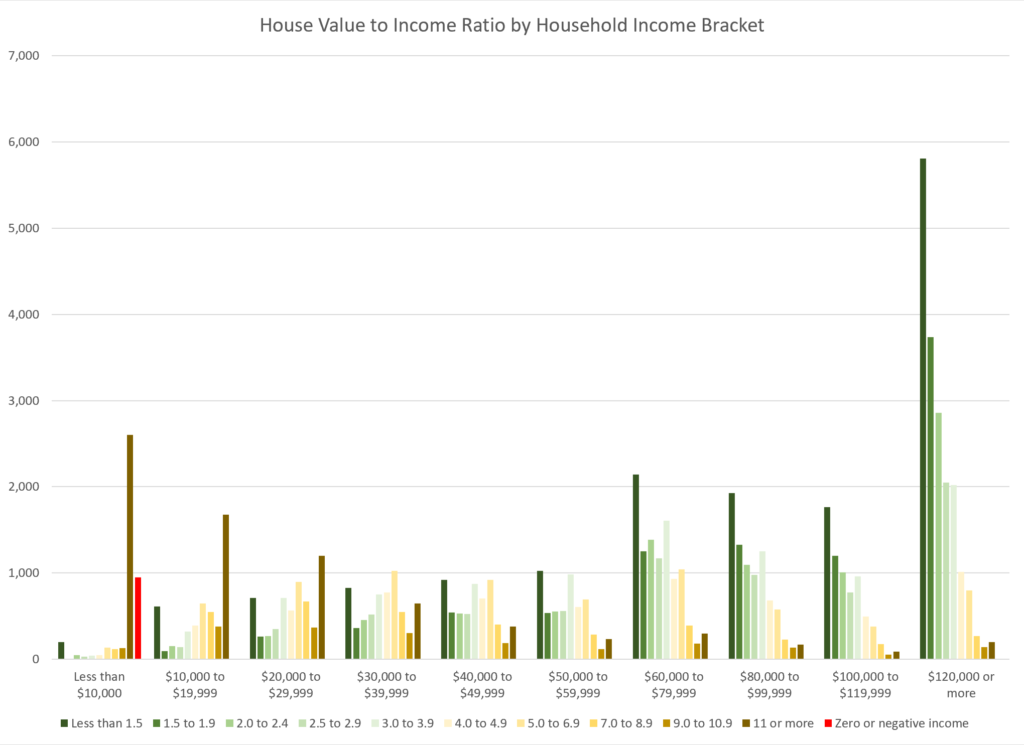
With the house cost, average down payment, and average interest rates we can calculate what the average monthly payment would be for the various price points and then use this to create a graph of what earnings would need to be to match with new home construction prices. However, this task is very difficult to do with data that has been aggregated into different overlapping categories as household income is groups into quintiles but new home purchase prices are grouped into categories varying in size between $50k and $100k. As such, data from household sales by price were compiled and the approximate cutoff point for house price quintiles were interpolated and compared against the Household Income quintile data from Table H-1. Income Limits for Each Fifth and Top 5 Percent of All Households: 1967 to 2018. The following chart is create from the ratio of the two numbers and it verifies the same general pattern seen from the AHS by household purchase price.
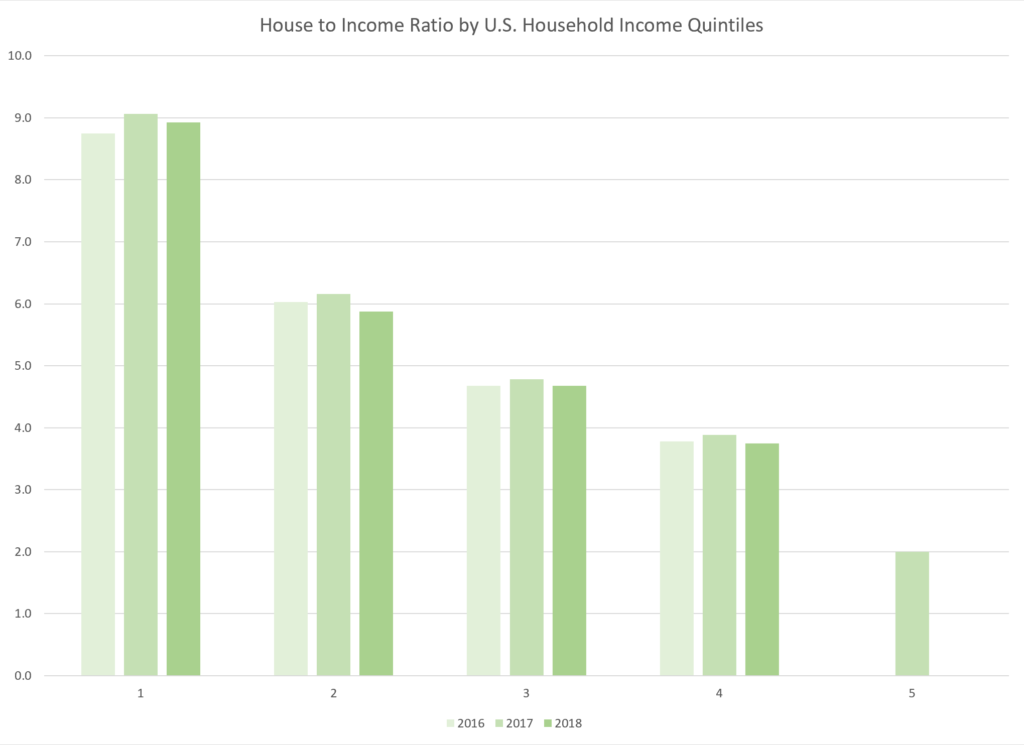
In conclusion, if we want to see a more equitable housing market where people from all income quintiles can partake we really need to work on providing a significant number of new housing units in the sub $200k range with an even heavier emphasis on the sub $125k housing market.
Other Useful Links and potential explanations for market inefficiencies
Interesting research article on price mismatches in the Netherlands https://link.springer.com/article/10.1007/s10901-016-9529-y
Total Market needs (does not address market segmentation) http://www.freddiemac.com/research/insight/20181205_major_challenge_to_u.s._housing_supply.page?
“It is possible that millennials are rejecting the homes boomers are selling (or the homes developers are building) because of a size mismatch, which bleeds into the affordability issue. Houses keep growing larger at the same time that US households are getting smaller. For example, the average size of newly constructed single-family homes in 1980 was 1,740 square feet. By 2007, the first year of the recent recession, the average home had reached 2,521 square feet, a 45% increase. Home size began to come down for a few years after the crisis but hit a new record in 2014 at 2,657 square feet.” https://qz.com/429559/millennials-cant-afford-to-buy-houses-even-though-we-really-need-them-to/
https://www.wsj.com/articles/a-growing-problem-in-real-estate-too-many-too-big-houses-11553181782
Look at the city planning and zoning policies that make it more difficult to build housing. https://www.chicagobusiness.com/residential-real-estate/builders-are-putting-fewer-new-houses-chicago-heres-why
Look at Minneapolis MN and how density restrictions have been lifted. https://slate.com/business/2018/12/minneapolis-single-family-zoning-housing-racism.html